Sustainability & Resilience
Revealing practical design solutions and ideas for reducing our carbon impact and leading the building industry toward net zero.
LATEST REPORTS & ARTICLES
Sustainability
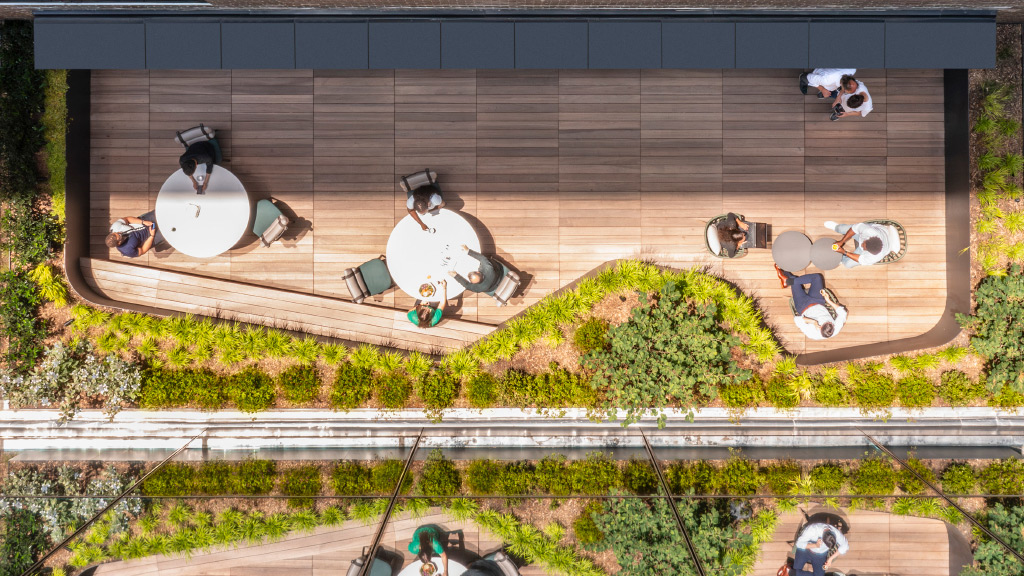
Resilience by Design
Our Resilience by Design Report presents solutions for transforming the built environment to achieve a net zero carbon impact across our portfolio and the design industry.
Blog
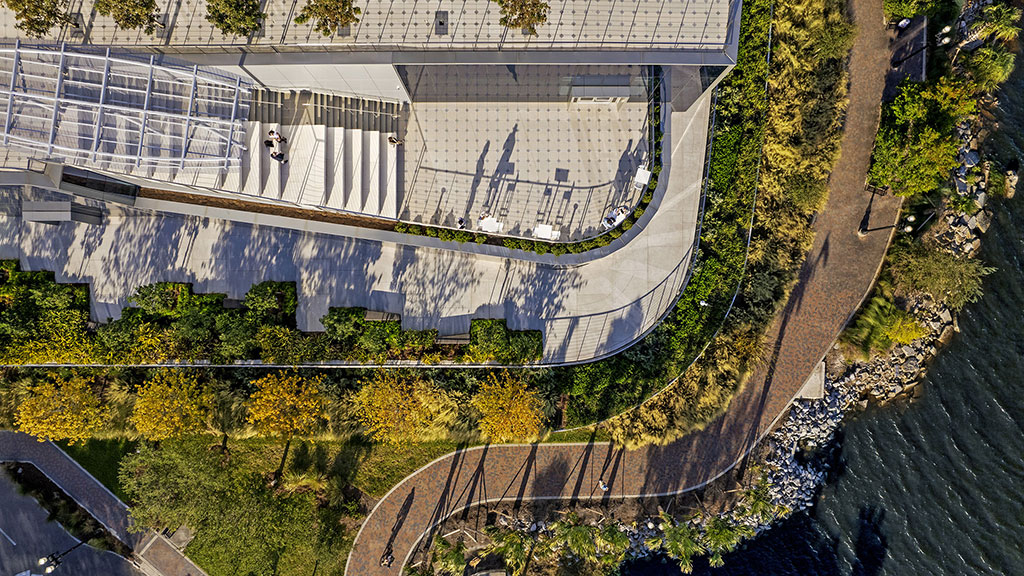
When Rivers Rise and Wells Run Dry: Designing Water-Resilient Cities
Climate change is making floods and droughts more intense — but designers have solutions that can limit the damage.
Research
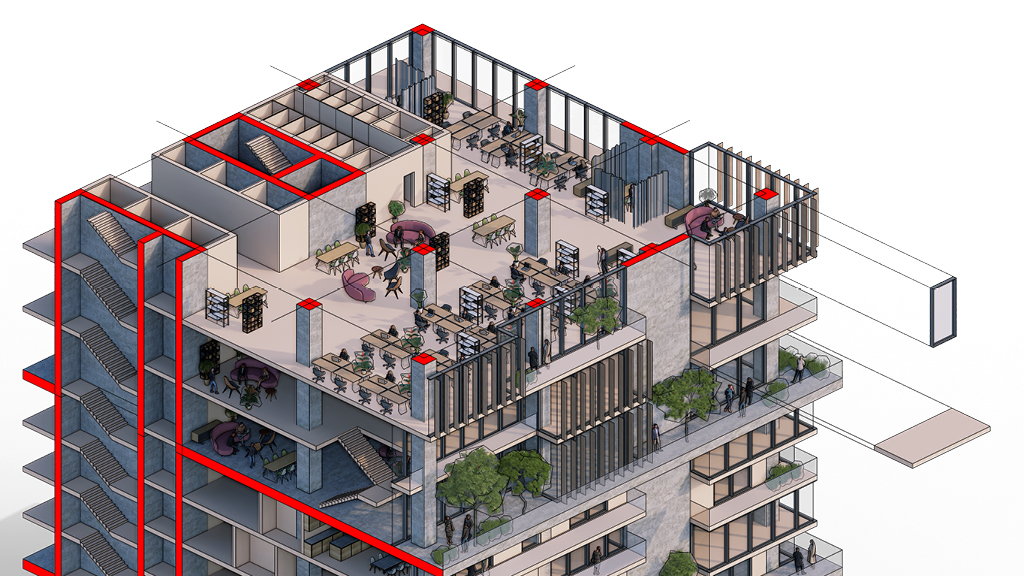
Building for Centuries
The “600-Year Office” concept explores how modular and flexible building designs can adapt over centuries to shifting societal demands, while embedding sustainable strategies to minimize environmental impact and maximize long-term functionality.
Blog
Scaling Circular Design: Key Policies, Standards, and Strategies
As momentum grows for circular design, cities and clients face significant challenges and opportunities to implement it widely.

Research
Commercial Office Building Electrification Playbook
The report outlines strategies for electrifying commercial office buildings, emphasizing the role of all-electric systems, heat pump technologies, and sustainable design in reducing greenhouse gas emissions and advancing carbon neutrality goals.

Research
How to Design Sustainable Digital Media Experiences
The research introduces a sustainability toolkit for digital media design, offering actionable strategies to reduce energy consumption, minimize e-waste, and integrate environmental goals into user experiences.

Research
Designing Amphibious Structures
The design of amphibious, modular structures, leveraging existing port infrastructure and small components for sunlight penetration, offers a scalable solution to create new marine habitats and restore coastal biodiversity in disturbed waterfront environments.

Research
Reducing Gypsum Wallboard Waste for a Sustainable Future
Tackling the global Gypsum Wallboard waste crisis requires localized, collaborative action across the material’s life cycle to enhance circularity and safeguard against significant public health risks and environmental degradation.

Research
Vulnerable Communities & Climate Change: Building in Resilience
Resilience hubs, which offer community spaces, disaster preparedness, and self-sustainability, can improve insurability, lower insurance rates, and enhance the resilience of vulnerable cities.
Blog
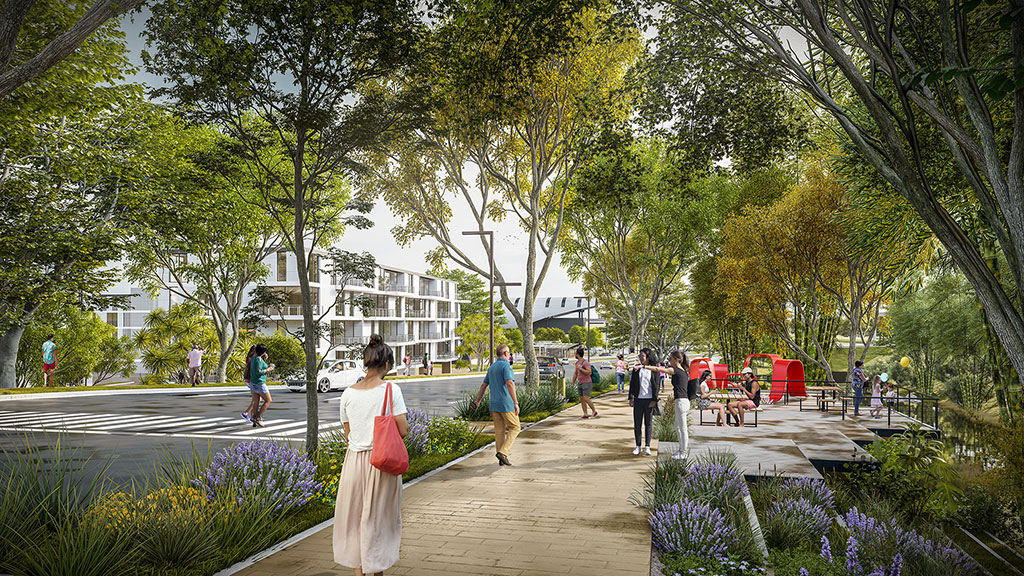
A New Vision for Urban Design in Tropical Climates
Through thoughtful, climate-responsive design, seemingly adverse conditions can become a distinct advantage for tropical cities.

Research
Sustainability and Lab Automation
Lab automation promises increased productivity and new scientific roles, but its current unsustainable energy demands and operational shifts necessitate re-evaluation for environmental impact, space planning, and workforce adaptation.
Blog
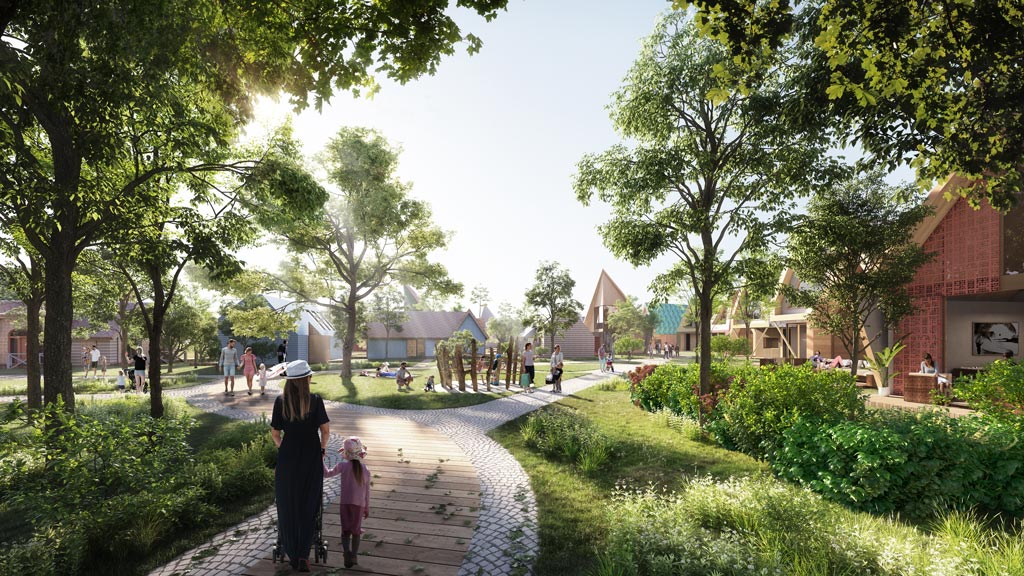
Severe Weather: The New Design Imperative
Buildings must be designed to protect the health, safety, and welfare of the public — and our infrastructure must be designed to withstand these extreme climatic events.
Blog
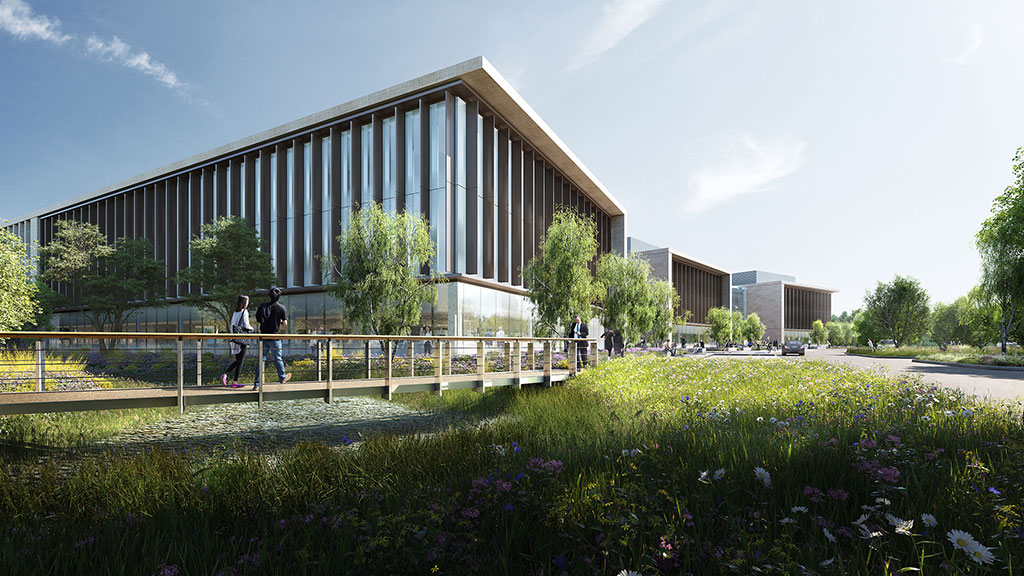
Biodiversity as the New Frontier for Achieving Resilience in Real Estate
The biodiversity crisis is a fundamental challenge that impacts life, the global economy, and the real estate industry.

Research
Global Climate Action Survey 2024
Gensler surveyed people around the world about their experiences with climate-related issues, such as extreme weather, and perceptions of whether their community is built to withstand the impacts of climate change.
Research
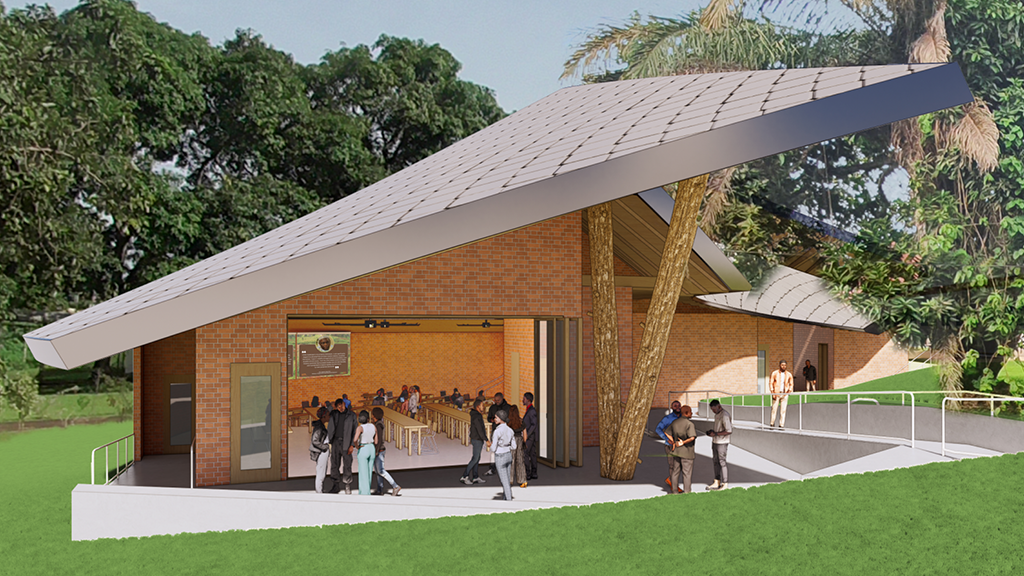
Shifting Carbon Neutral Into Drive: The Congo Basin Institute
We partnered with UCLA’s Institute of Environment and Sustainability to investigate design methods for carbon neutral buildings in the Congo Basin of Cameroon.

Blog
How London’s Green Real Estate Can Lead the Global Climate Agenda
Despite global decarbonisation efforts, emissions continue to rise. But the UK is quietly and steadily reducing its carbon footprint.
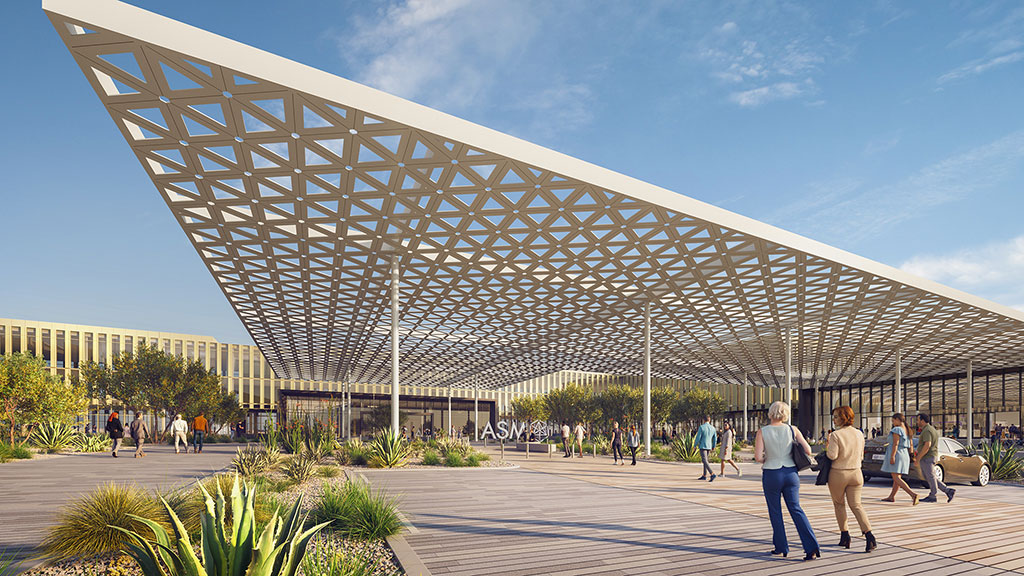
Blog
Four Big Takeaways From Gensler’s New Global Climate Action Survey
What is the state of climate change perceptions in 2024?
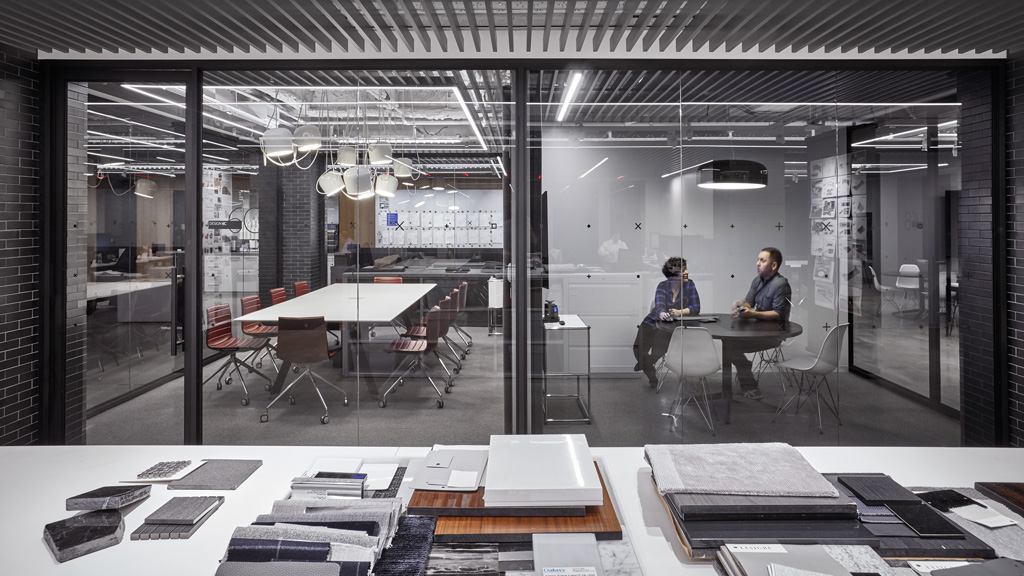
Blog
Three Principles for High-Impact Sustainable Design Guidelines
Translating sustainability commitments to design strategy.
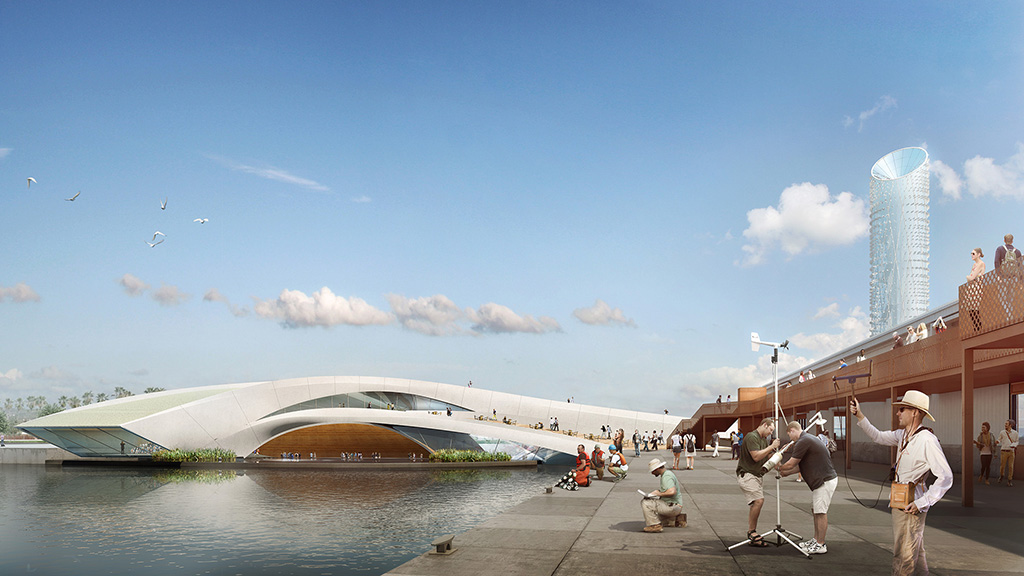
Blog
Laying the Groundwork for Climate Preparedness
Gensler’s Resilience Preparedness Framework develops concrete actions that designers can take to address climate shifts.
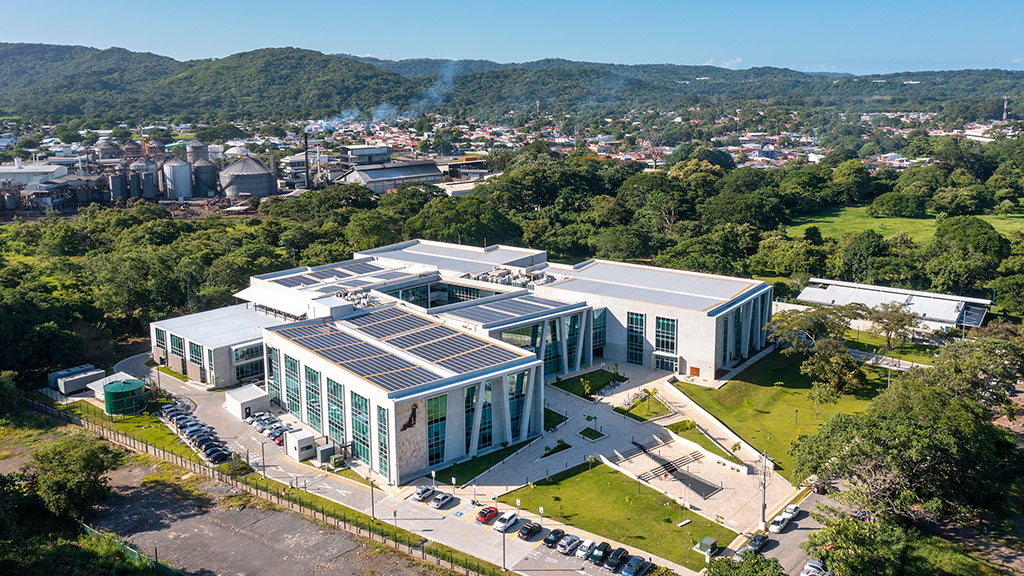
Blog
Climate Resilience in the Latin American Caribbean: Challenges and Opportunities
To mitigate the effects of climate change in the region, we must adapt cities, strengthen infrastructure, and protect vulnerable communities.

Blog
Communicating Sustainability: Quantifying, Qualifying, and Celebrating Climate Impact Achievements
Wherever a company or brand may be on its sustainability journey, telling the story of impact in a way that is both authentic and transparent is increasingly crucial.
Research
The Carbon Footprint of Work
We quantified the true carbon cost of office work in multiple scenarios and cities to understand the best ways to reduce total associated carbon emissions.
Blog
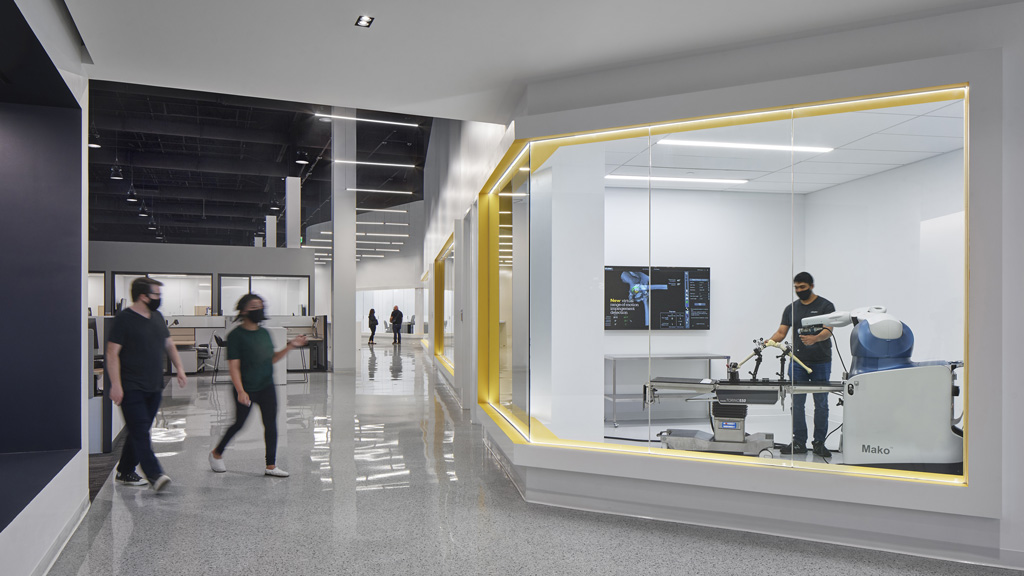
The Future of Lab Automation: Opportunities, Challenges, and Sustainable Design Solutions
Automation in labs isn’t just about advanced tools; it’s about creating an ecosystem that considers workflow efficiency, spatial design, and environmental sustainability.
Blog
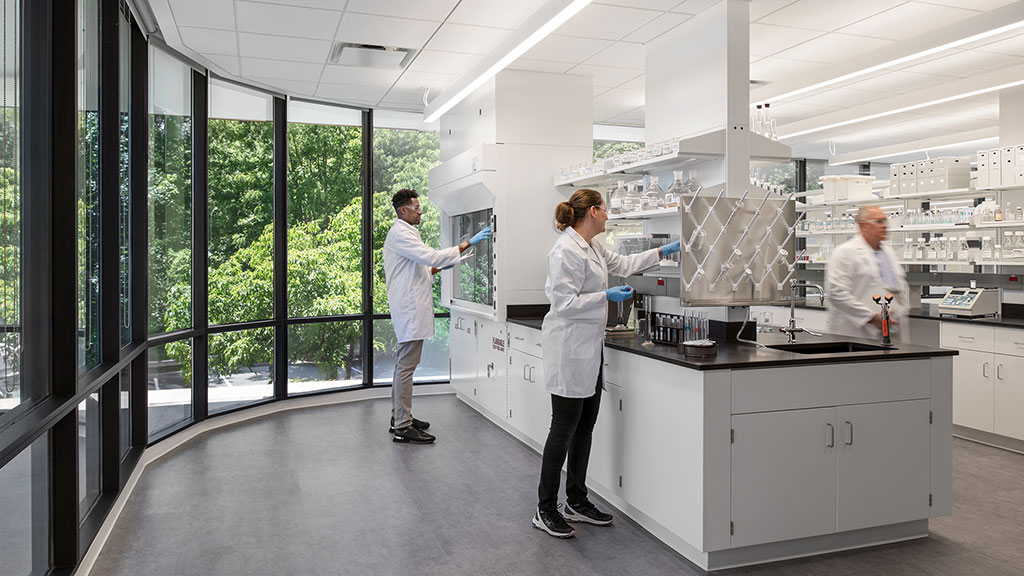
Design for Laboratory Resilience: A Compliance Approach to Climate Risk Assessment
Innovative sustainable design of laboratory buildings must factor in risk of regional natural disasters and affected communities.

Blog
The Importance of ‘Carbon Storytelling’ in Future Sustainable Architecture
‘Carbon storytelling’ will be essential for sustainable buildings of the future — here’s why.

Research
Sustainable Shade Structures
We researched how to offset the effects of extreme heat in at-risk communities through community co-creation of shading structures.

Research
Designing Food-Resilient Cities
We researched how designers can reimagine food production to cities to better connect residents to their food and foster a food-resilient future.
Blog
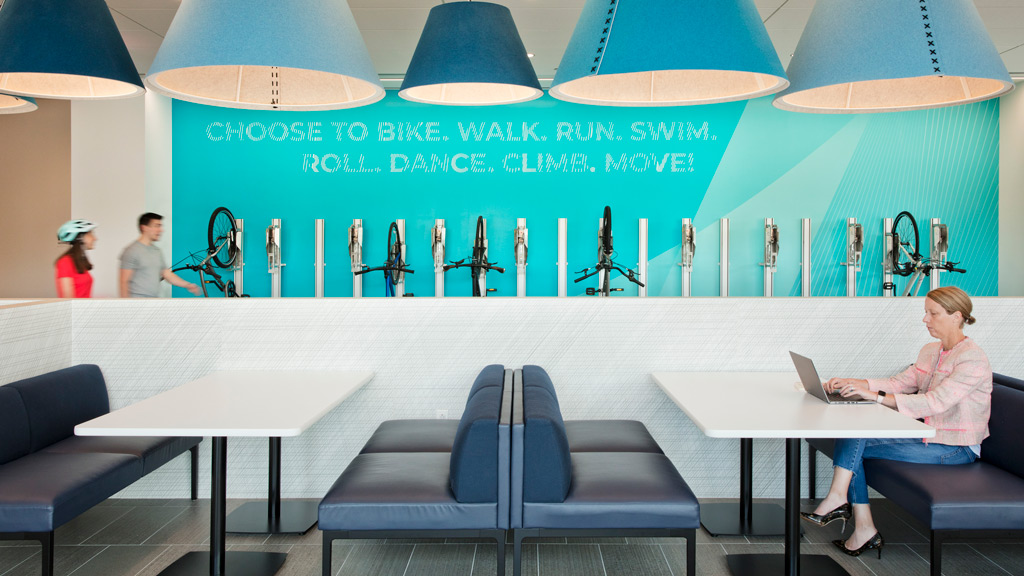
When the Commute Is Worth the Carbon
The Gensler Research Institute has consistently studied the pandemic's impact on work, revealing a persistent concern for organizations and cities: the commute.

Research
Designing the 2030 Sustainable Office
We developed a framework that stakeholders can use to meet vital embodied and operational carbon targets and achieve sustainable offices by 2030.
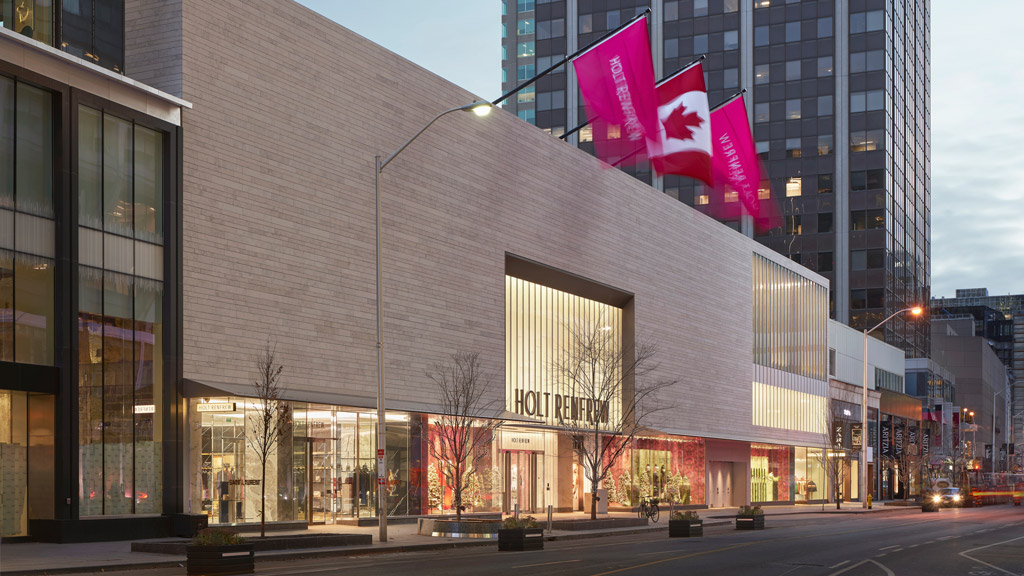
Blog
Implementing Sustainable Design Strategies in the Retail Environment
Here’s how linking sustainability efforts to the customer experience helps grow brand value and move us toward a more sustainable future.
Research
Quantifying Embodied Carbon
We investigated the greatest drivers of embodied carbon in our projects and created actionable steps for implementing design and specification practices to reduce our embodied carbon outputs.
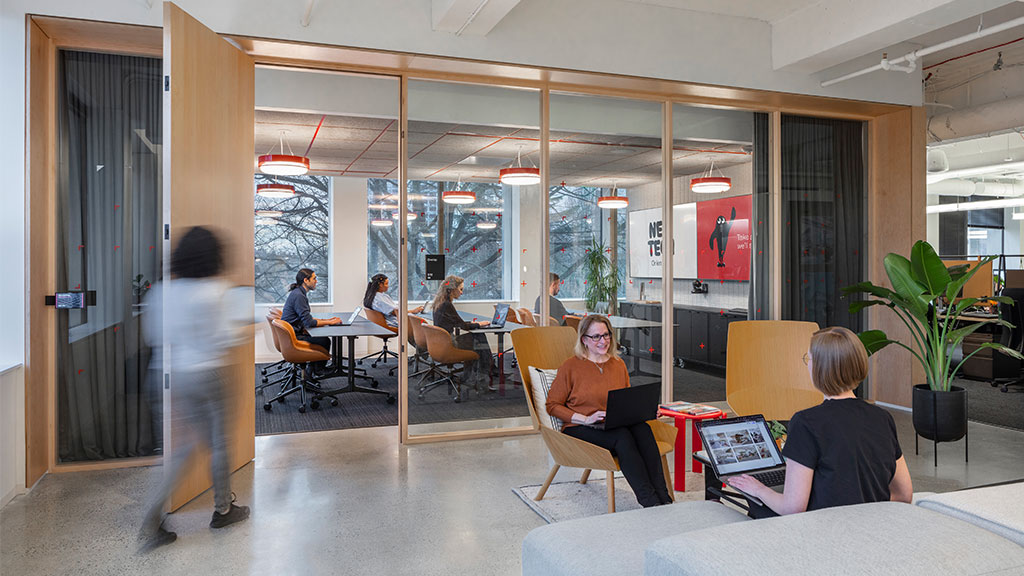
Blog
Embodied Carbon Is Where Tech Must Tighten Its Belt
As buildings get more efficient and power grids get cleaner, projects are looking to where they can further reduce their carbon footprint to meet their net zero commitments.
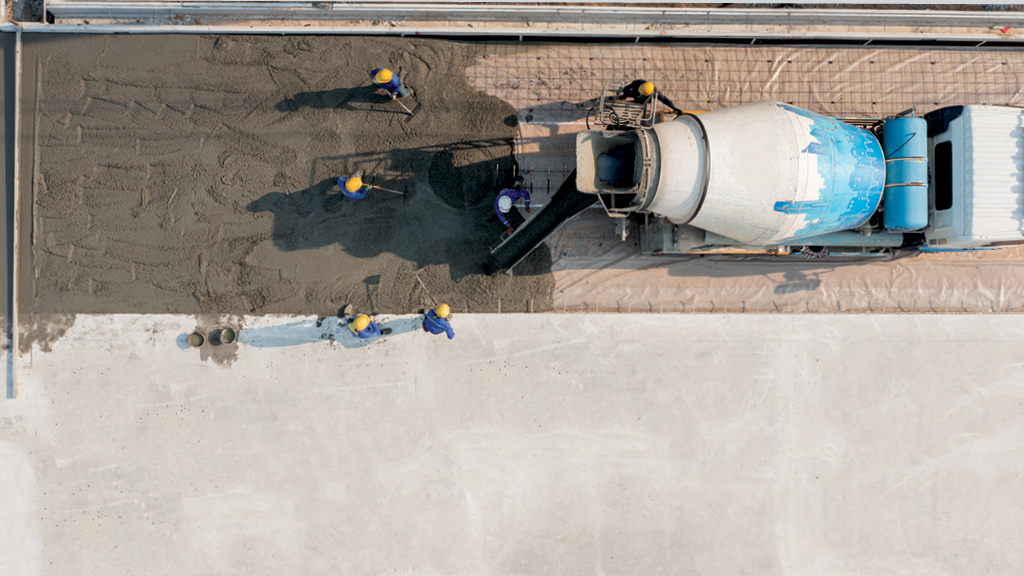
Research
Designing for Lower Carbon Concrete in Data Center Constructions
The construction boom of data centers raises questions about their carbon footprint. We convened industry experts to understand how we can reduce the embodied carbon of data centers with lower carbon concrete.
Blog
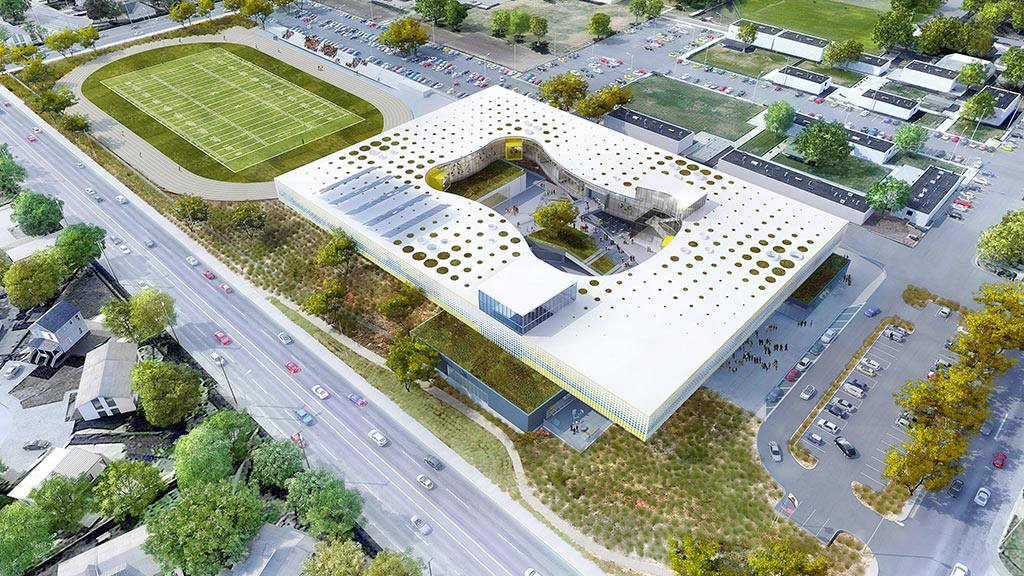
5 Strategies for Heat Resilient Design
Here are five strategies we need to embrace to create heat resilient design solutions for the coming years.
Blog
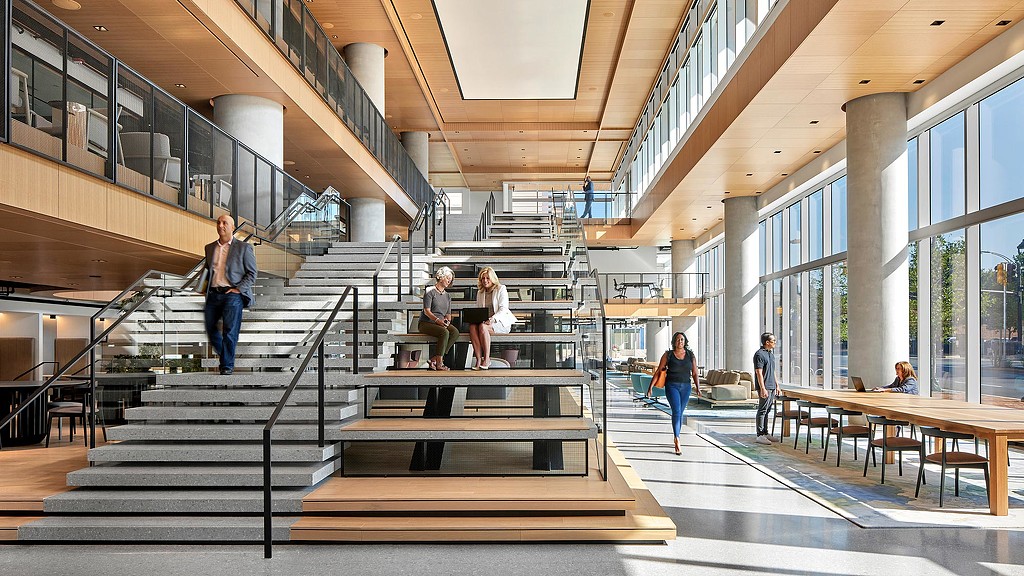
A Material Approach to Lowering Carbon and Changing the Building Industry
Gensler Co-CEO Jordan Goldstein talks about Gensler’s Product Sustainability (GPS) Standards and what it means for the industry.
Blog
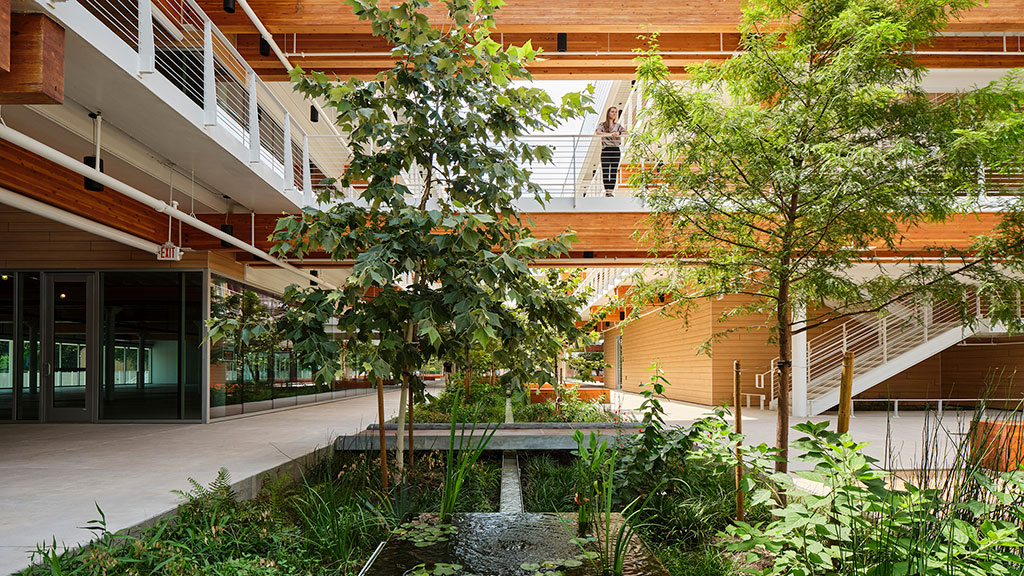
Extreme Weather Demands an Immediate Design Response
Gensler’s Climate Action Survey 2023 explores how design can address the rapidly accelerating climate crisis.
Podcast
How is Decarbonization Changing Architecture and Design?
We define embodied carbon vs. operating carbon, address net carbon impact, discuss how we approach resilience with clients, and weigh the impact of carbon...
Blog
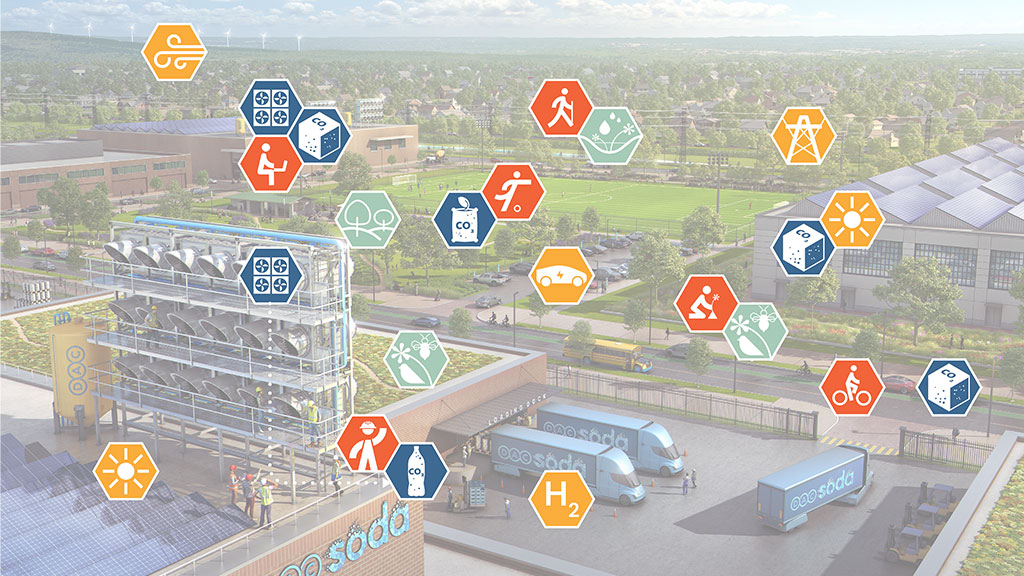
Borealis: The Opportunity for Building Integrated Carbon Capture to Reverse the Carbon Footprint of Buildings
If applied across Gensler’s global portfolio, direct air capture technologies could remove 14.5 million tonnes of CO2 from the atmosphere.
Blog
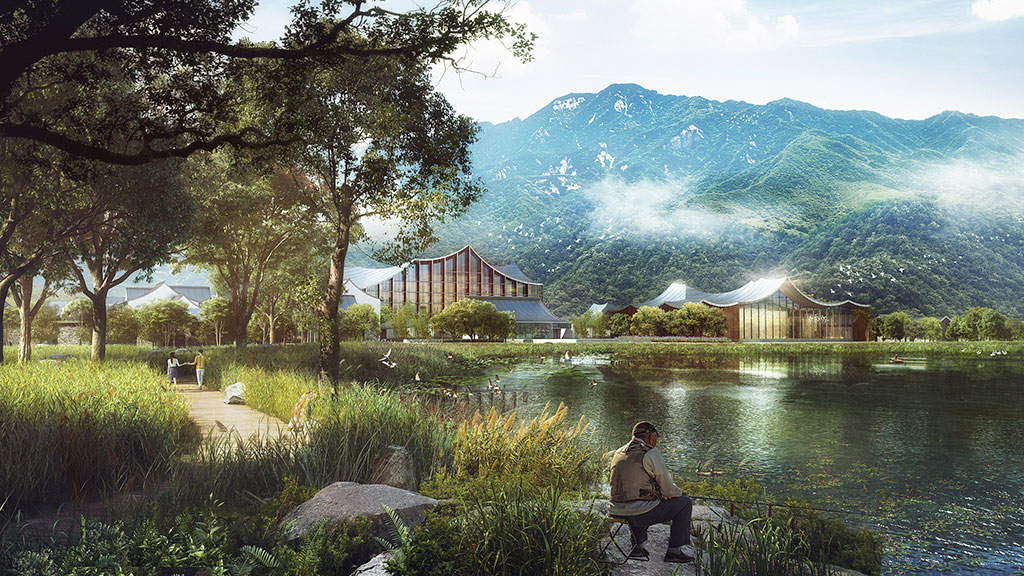
Why It’s Time to Apply Regenerative Systems Design on a Global Scale
Regenerative architecture offers a more sustainable path forward.

Blog
The Biogenic Materials Revolution Has Begun and Mass Timber Is Leading the Way
Biogenic materials will be crucial in our efforts to address climate change while also meeting the vast global demand for new buildings and spaces.
Blog
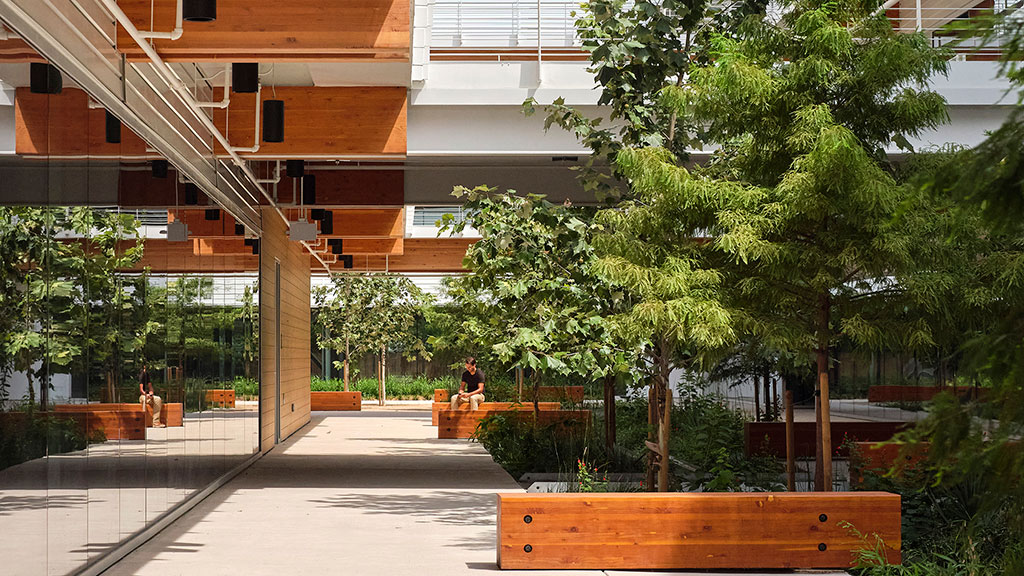
How Biophilia, Biomimicry, and Bioclimatic Strategies Will Transform the Future of Design
By incorporating biophilic, bioclimatic, and biomimicry design strategies, we can raise the bar for what acting sustainably means.
FEATURED SUSTAINABILITY PROJECTS
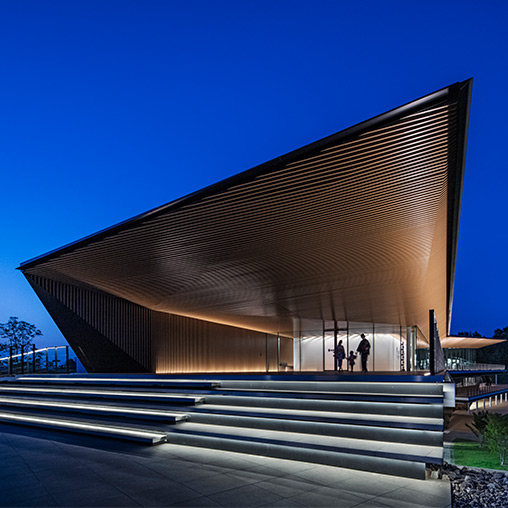
MARUWA Seto Factory
Seto, Aichi, Japan
As a global leader in ceramic materials for electronics, MARUWA partnered with Gensler to transform their Seto, Japan factory into a cutting-edge global hub, revitalizing a site once known for illegal dumping.
Gensler San Francisco
San Francisco, California
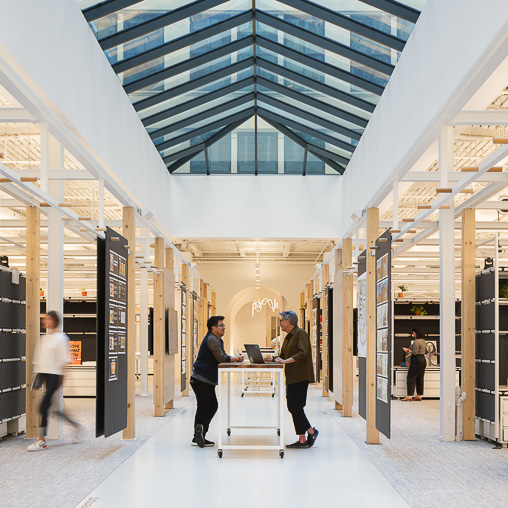
Gensler’s San Francisco carbon-zero energy office is a living lab for the future of work and a community hub that reenergizes its downtown.
Ericsson USA 5G Smart Factory
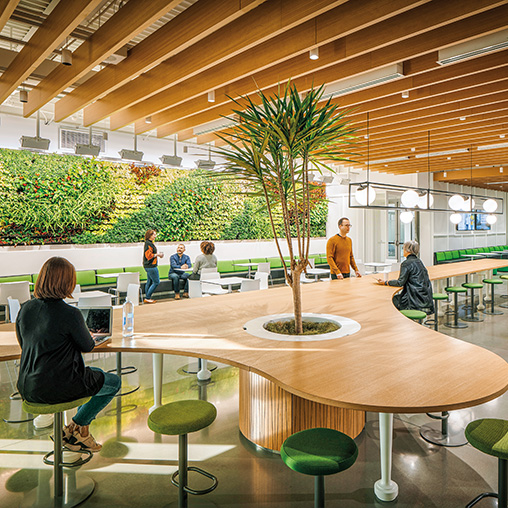
Ericsson’s USA 5G Smart Factory moves manufacturing closer to their consumers and prioritizes operational efficiency.
SUSTAINABILITY & RESILIENCE NEWS
-
AllWork
2025AllWork published insights by Gensler Global Co-Chair Diane Hoskins on why shared office space is a greener choice than working from home. The article cites studies by the Gensler Research Institute, in collaboration with MIT, on the carbon footprint of where we work and benefits of shared systems. -
Propmodo
2025Propmodo spotlighted how Gensler built a tool that displays the carbon impact of design choices in real time using AI and the firm’s data across over two billion square feet of projects. Chief Digital Officer Joseph Joseph explained how the tool can help designers make informed decisions. -
Reuters
2024Reuters’ The Switch interviewed Design Resilience Leader Rives Taylor about how architecture is adapting to climate change and solutions for locales experiencing extreme heat and flooding. Watch the episode.
Interested in working with us?