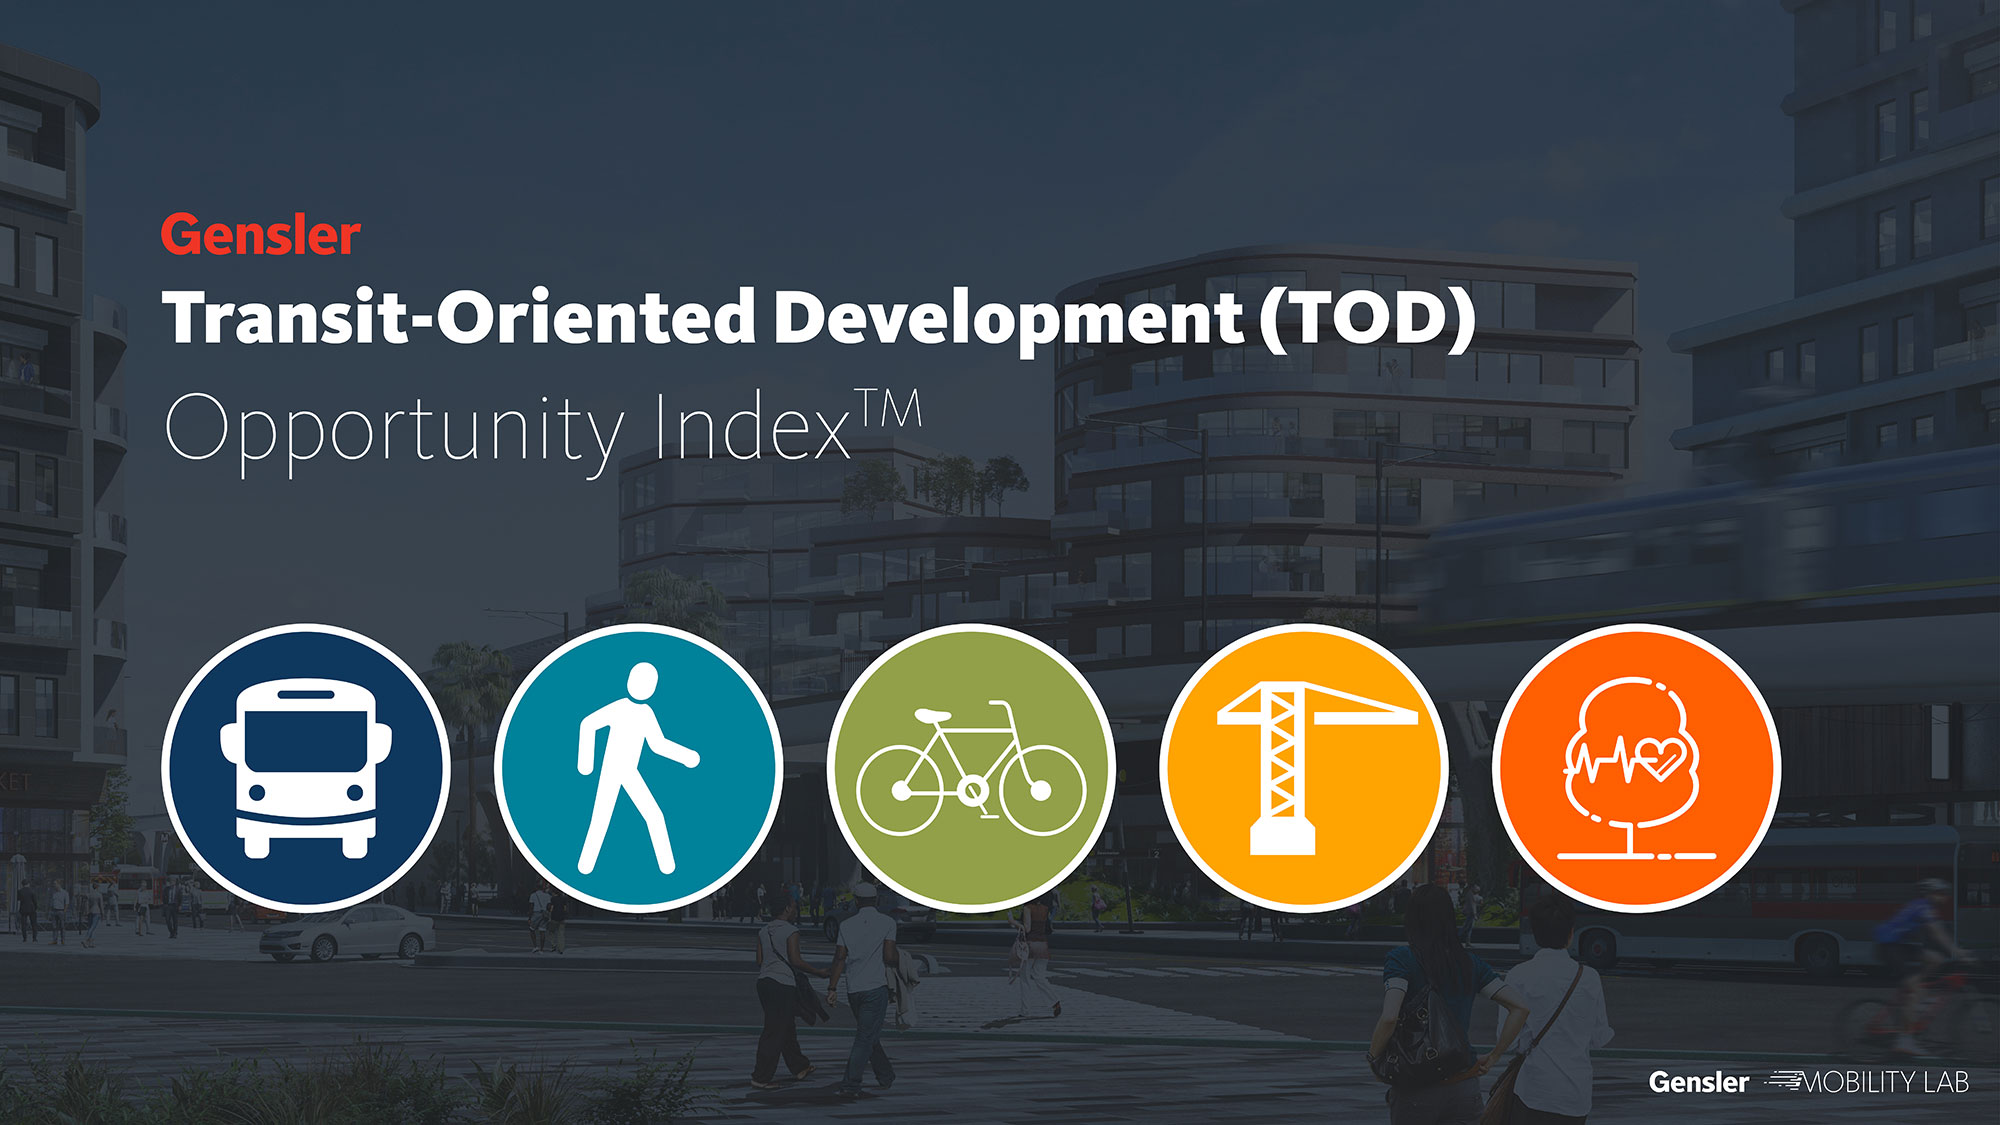
Introducing the Gensler TOD Opportunity Index
The Gensler Transit-Oriented Development Opportunity IndexTM is a tool for evaluating the development potential of station areas to support housing, increase transit ridership, and reduce greenhouse gas emissions.
American cities face complex, intersecting challenges related to housing, transportation, and climate change. Nationwide, a lack of housing supply is creating an affordability crisis: the United States is now short 3.2 million housing units. At the same time, public transit agencies are struggling to recover ridership, with U.S. transit ridership in 2023 at only 77% of pre-pandemic levels. While transit use is in decline, the transportation sector as a whole is now the largest source of greenhouse gas (GHG) emissions, with the EPA reporting that transportation accounts for 28% of U.S. GHG emissions. Done right, transit-oriented development (TOD) can address all three issues.
Prioritizing development around transit stations has the potential to add much-needed housing, increase transit ridership, and reduce greenhouse gas emissions by creating walkable communities that reduce the need to drive. California alone has the potential build up to 3 million homes within a half-mile of transit over the next two decades, helping the state solve its housing crisis while meeting its ambitious goals for reducing greenhouse gas emissions. For these reasons, local, regional, and state governments are all turning their focus to TOD.
How It Works
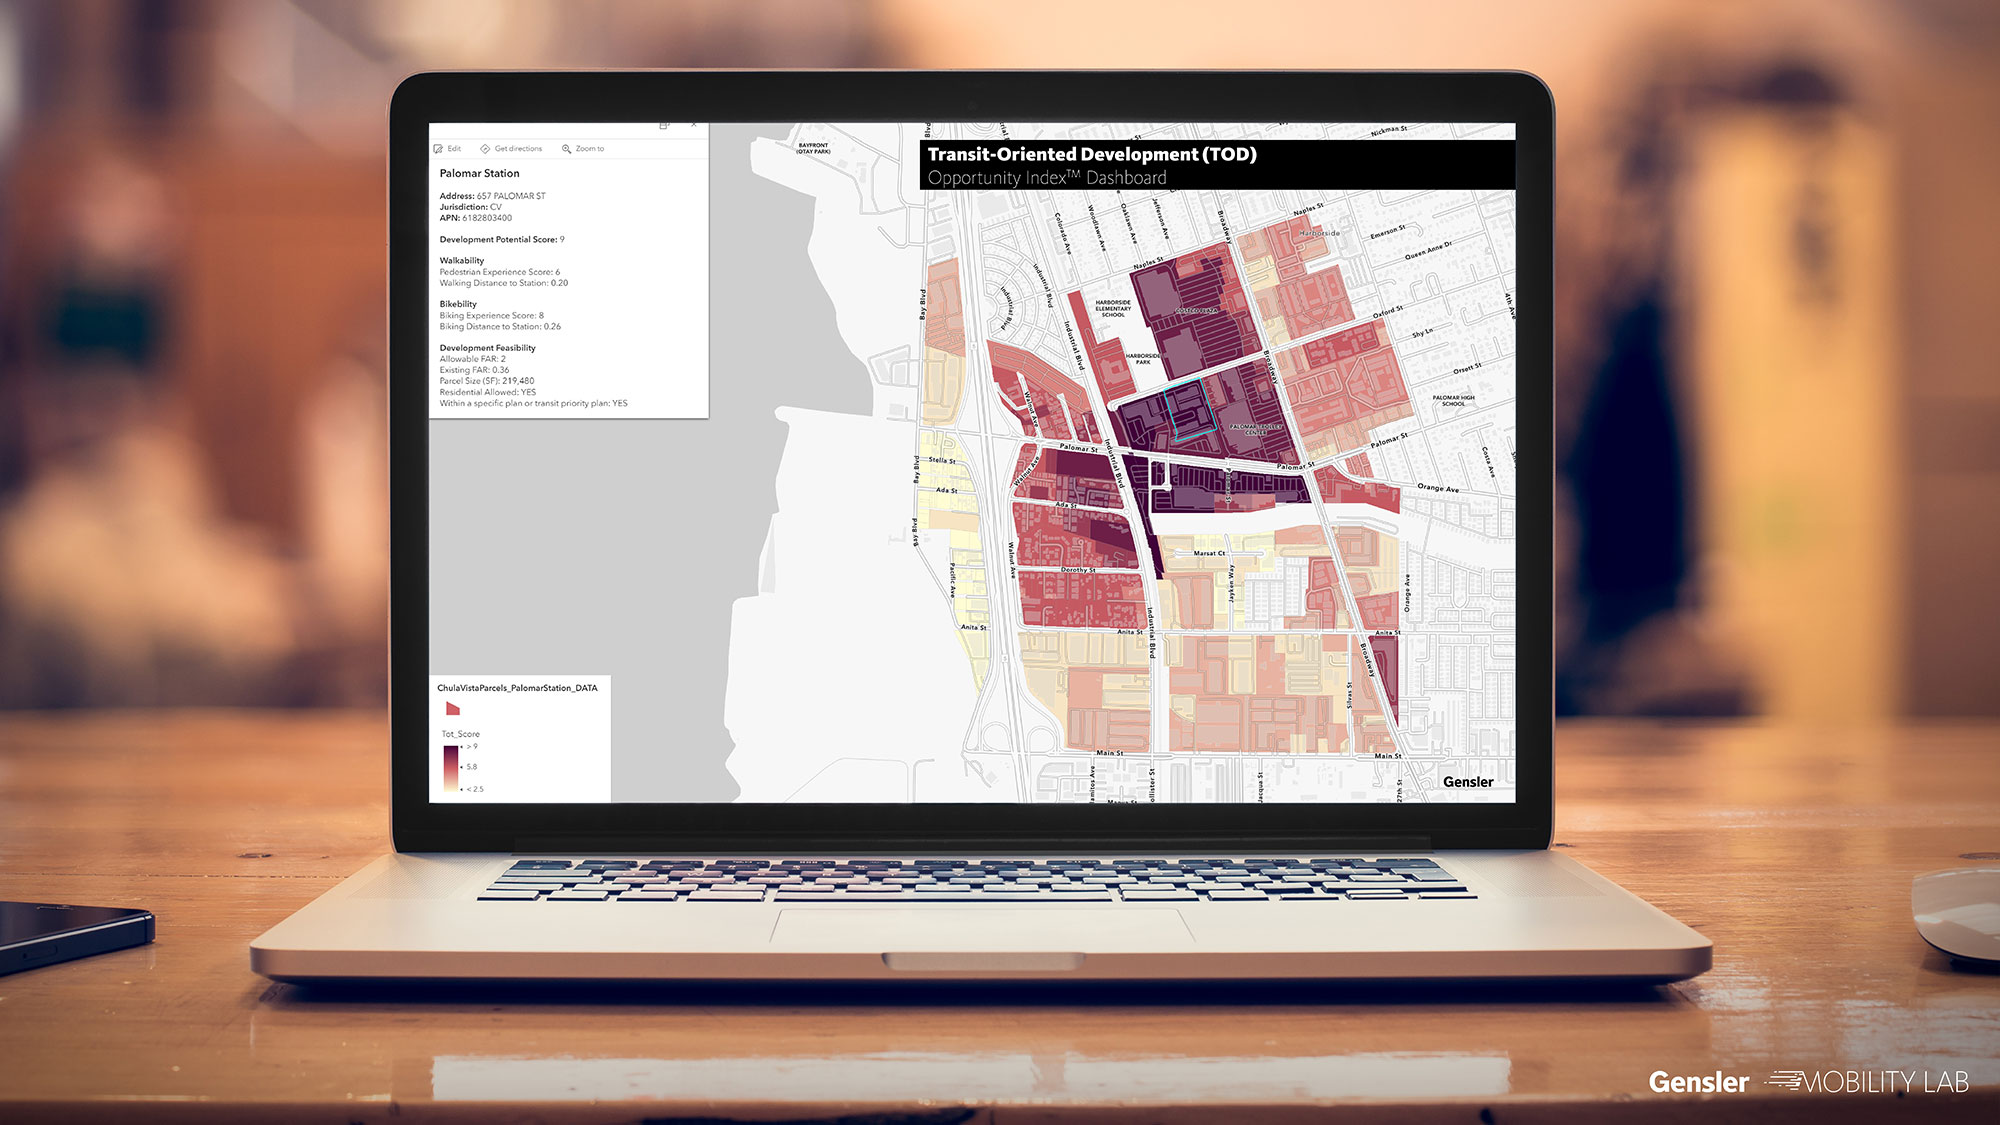
The Gensler Transit-Oriented Development (TOD) Opportunity IndexTM is a tool for evaluating the development potential of transit-station areas. It incorporates social, environmental, and economic factors to help cities, transit agencies, and developers evaluate existing real estate assets for TOD potential, plan and prioritize development opportunities, and measure their impact. By providing an evidence-based approach to TOD planning, the TOD Opportunity Index allows public agencies to take advantage of new federal-funding opportunities for TOD planning and development, unlocking the unrealized value of existing stations and facilities.
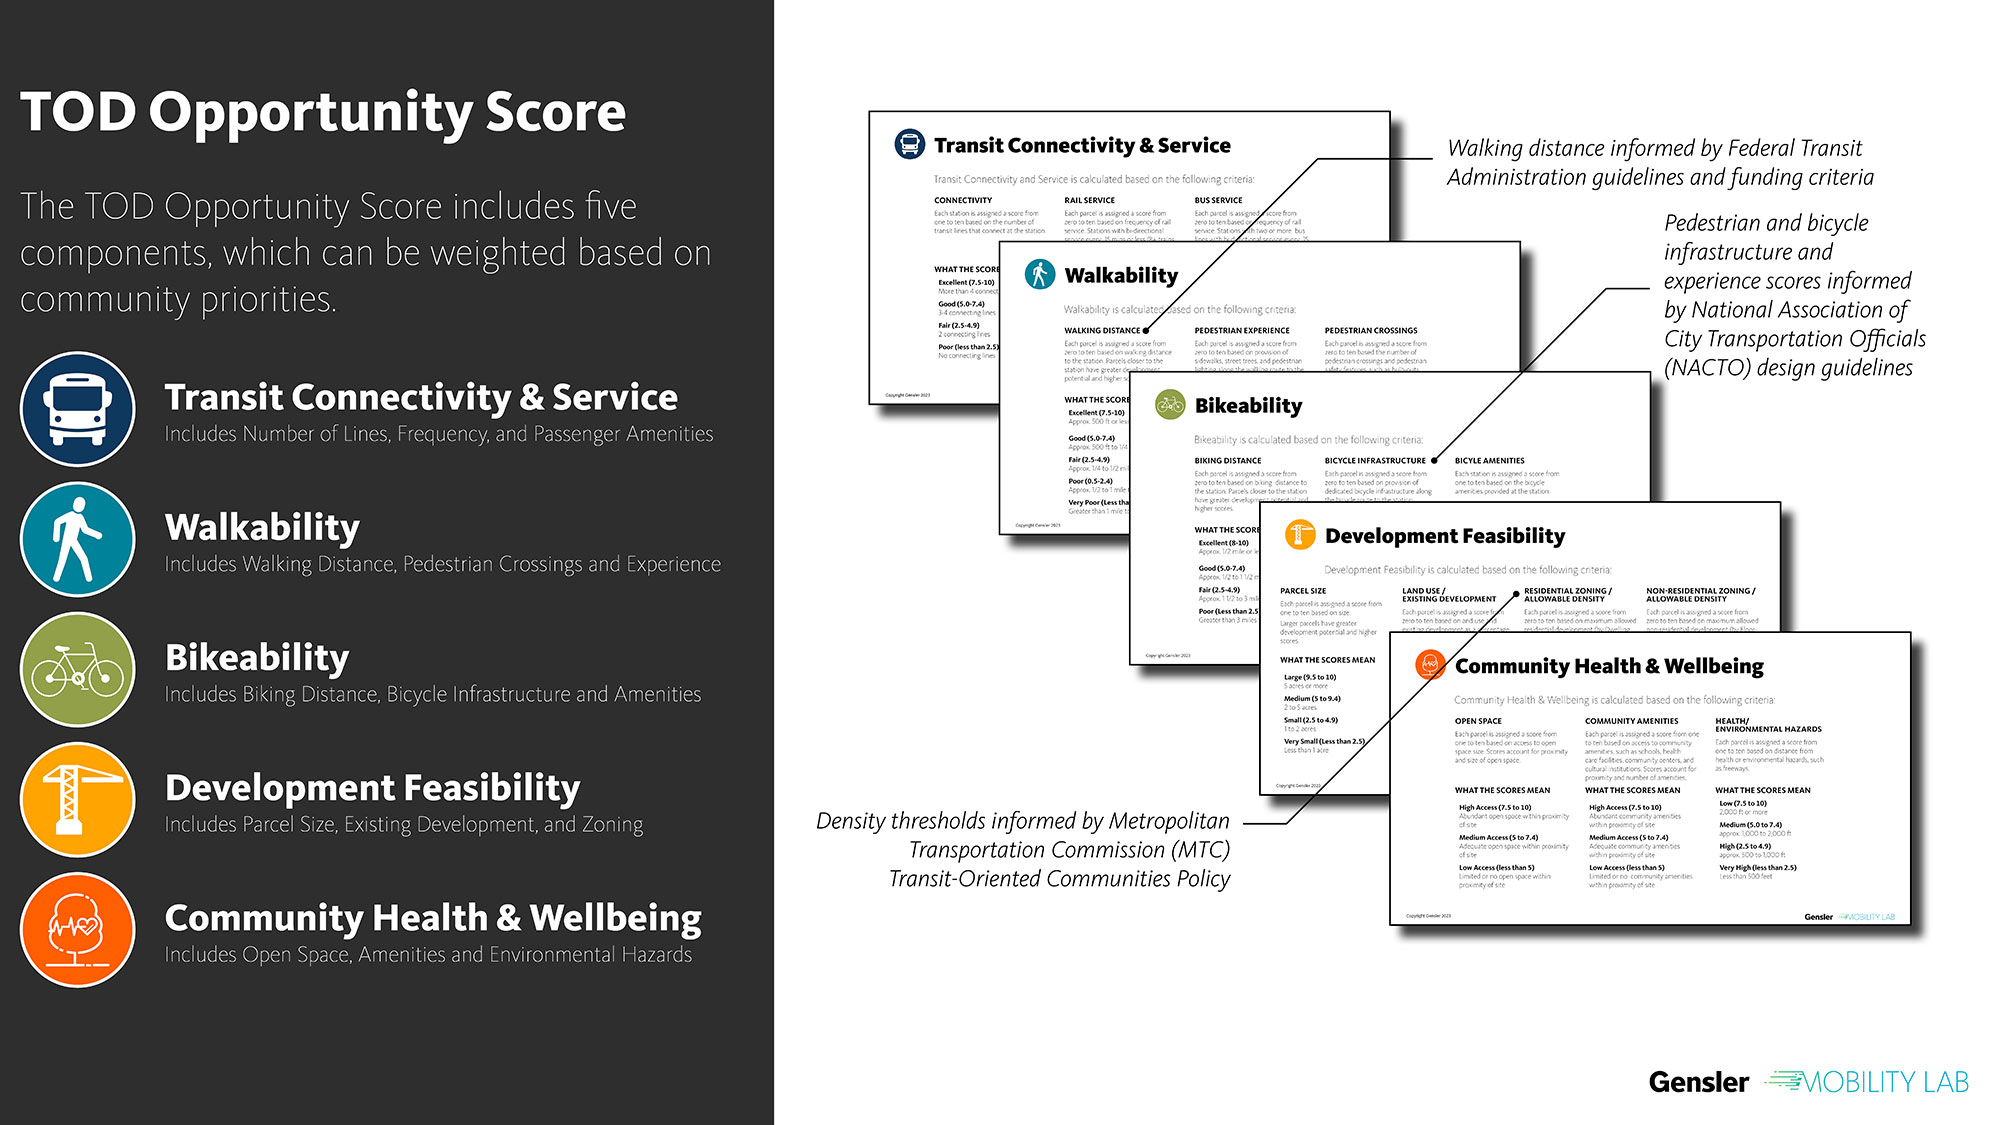
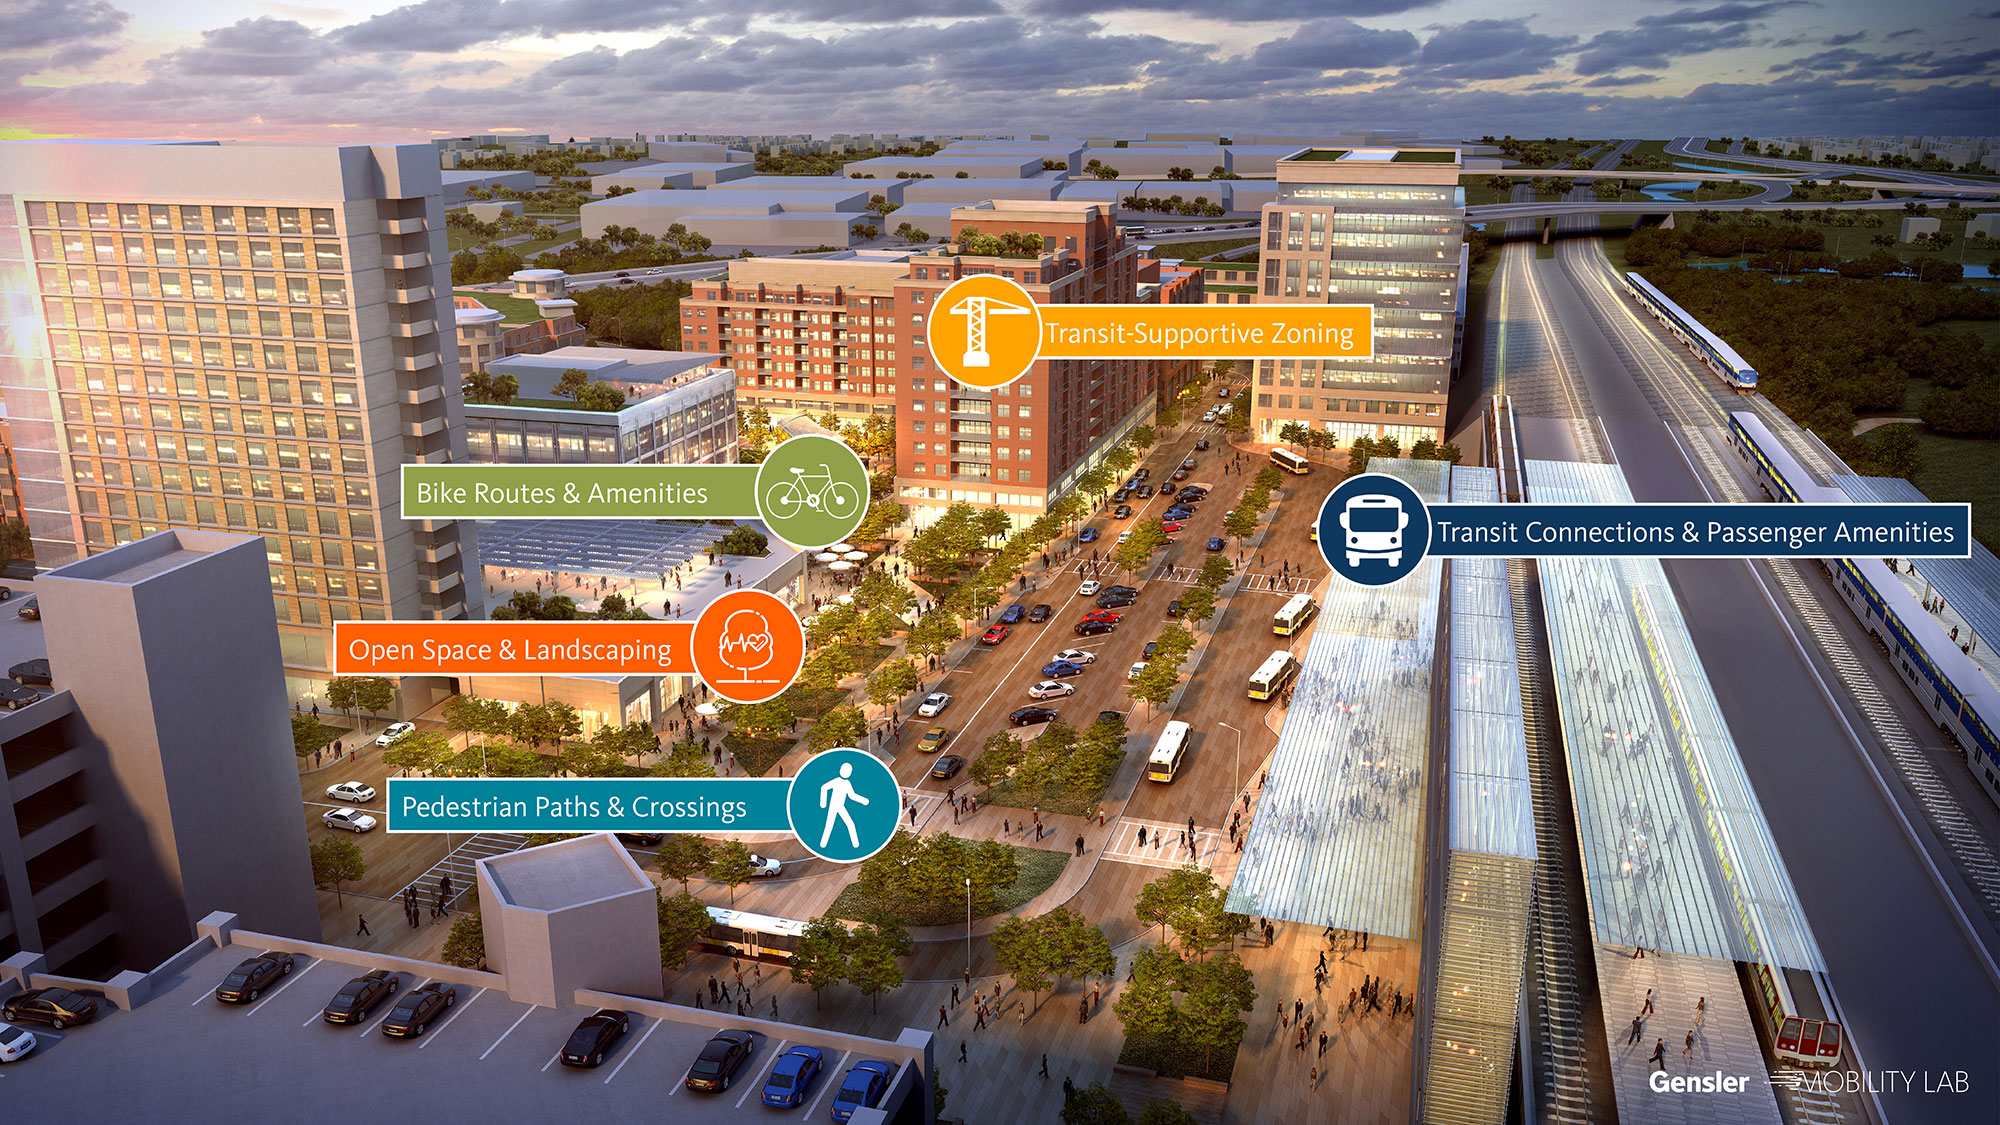
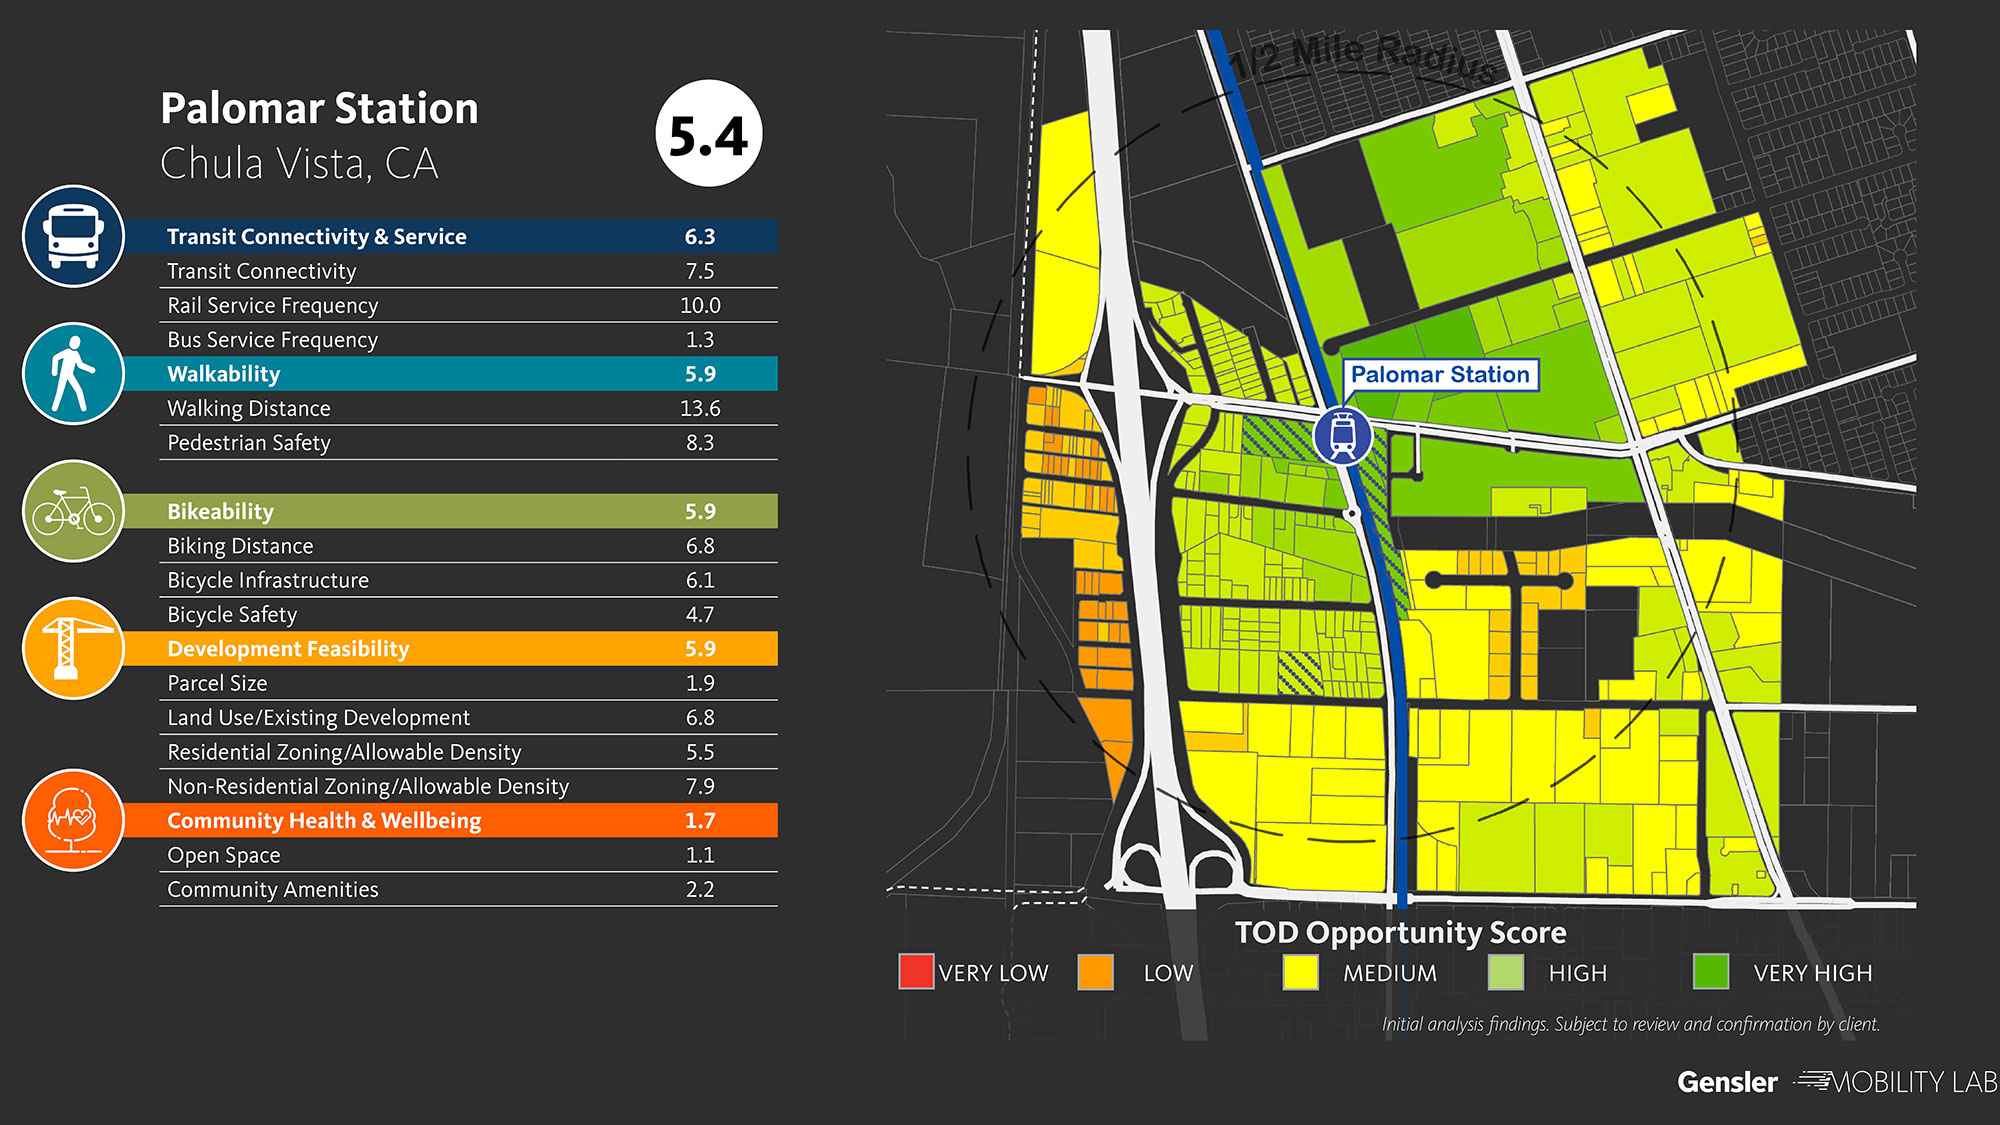
Using quantitative analysis of pedestrian, bicycle, and transit access; existing development; and planning context, the tool calculates a TOD Opportunity Score for each parcel within a station area, as well as the station-area neighborhood as a whole. The TOD Opportunity Index uses GIS-based analysis to aggregate five components that contribute to TOD development potential: Transit Connectivity & Service, Walkability, Bikeability, Development Feasibility, and Community Health & Well-being. Each component includes multiple metrics, such as distance to station, parcel size, and existing development relative to the total allowable density, which can be weighted to reflect local priorities. The TOD Opportunity Index can be used to compare the development potential of different station areas, identify TOD opportunity sites within a station area, and evaluate the effectiveness of TOD land use and mobility plans.
Case Study #1: Reimagining Regional Rail in Maryland
Gensler is currently using the TOD Opportunity Index to help the Maryland Department of Transportation evaluate the development potential of six stations along the MARC Penn Line between Baltimore and Washington, in partnership with HR&A Advisors. Commuter rail services, such as MARC, have been slower to recover ridership than other modes of transit, making existing park-and-ride lots at suburban stations a prime opportunity for development. Realizing the potential for TOD at these stations is central to the state’s strategy to reimagine this commuter corridor and revitalize ridership post-pandemic.
Transit-oriented development is also a key part of Maryland Governor Wes Moore’s plan to address housing needs in the state, where a new law will expedite and simplify approval for TOD projects. Speaking at the bill-signing ceremony for that legislation, Governor Moore said, “We made the choice to put housing front-and-center this year because we know this issue can’t wait. Building a stronger housing market can’t wait. Tackling a housing shortage of 96,000 units in Maryland can’t wait.”
The project demonstrates how incorporating transit-oriented development can benefit cities. “Local governments are investing big in transit,” said Christopher Rzomp, global co-leader for Gensler’s Cities & Urban Design practice. “It’s a generational opportunity for planners to rethink both urban and suburban stations. Across the country, our clients see TOD as a way to catalyze development in underserved areas, connect more people to jobs, and create equitable and affordable alternatives to exurban and downtown living.”
Case Study #2: Creating Sustainable Communities in San Diego
In San Diego, Gensler is using the TOD Opportunity Index to analyze the development potential of parcels within two station areas along the Blue Line Trolley corridor and identify opportunity sites for catalytic development with a focus on equity. Quantitative analysis of potential opportunity sites, with review and input by local community-based organizations (CBOs), helped the team ensure an equitable approach while helping meet the region’s housing and transportation goals.
Planning for growth near transit is critical to the San Diego Association of Government’s (SANDAG) Sustainable Communities Strategy, says SANDAG Senior Director of Regional Planning Antoinette Meier.
“SANDAG’s Sustainable Communities Strategy focuses future development and growth near transit to help meet state housing and climate goals,” Meier said. “We appreciated the ability to customize the TOD Opportunity Index tool for our region and identify areas where TOD is best suited. It helped us to provide better information to project stakeholders. We see this study as a launching pad for TOD planning and collaboration in the region.”
Gensler used the results of the analysis to develop a prioritized list of transportation and land-use improvements, such as bus-stop enhancements, new street trees, and pedestrian crossings, to increase the TOD potential of parcels within the study area.
“The TOD Opportunity Index is helping transit agencies and station designers like us to take a holistic look at station improvements and opportunities around existing and new transit corridors,” said Carmen Cham, global co-leader for Gensler’s Mobility & Transportation practice. “It has not only allowed us to see and measure how improving the experience of getting to and from a station positively impacts individual riders, but also the places and communities around them.”
Innovation Driving Impact
Together, these projects on opposite sides of the country demonstrate the ability of TOD to support the social, environmental, and economic well-being of cities and create cleaner, healthier, more sustainable communities.
Diverse, mixed-use, walkable communities promote human connection and belonging, with residents in one study reporting higher life satisfaction and lower levels of loneliness. Active transportation, such as walking and biking, and access to open space enhance health and well-being. The TOD Opportunity Index supports the social and experiential fabric of our communities by incorporating metrics on community amenities and health impacts in the planning process through the metrics on walkability, bikeability, access to open space, and consideration of environmental hazards and health risks, such as proximity to freeways.
People who live, work, or shop in TODs drive 20-40% less and reduce greenhouse gas emissions by 2.5 to 3.7 tons per year per household, according to the Maryland State Department of Planning. Additionally, TOD residents use transit four to 10 times more than those who live in other areas, according to the Victory Transportation Policy Institute. Climate impacts are evaluated in the TOD Opportunity Index through the metrics on transit service, walkability, and bikeability in order to identify development sites with the greatest potential for non-automobile use.
For cities or transit agencies with underutilized parking lots, converting those sites to TOD can provide a potential source of revenue and riders. New laws and federal policy changes have increased funding for both public and private TOD projects with over $68.9 million available for TOD planning grants over five years. Additionally, recent policy changes by the U.S. Department of Transportation Build America Bureau now allow TOD projects within a half-mile walking distance of certain transit and railroad stations to qualify for Transportation Infrastructure Finance and Innovation Act (TIFIA) and Railroad Rehabilitation & Improvement Financing (RRIF) loans, allowing access to project financing at favorable interest rates.
The TOD Opportunity Index can support cities and developers in accessing these resources by streamlining the analysis process and identifying sites that have the greatest potential for development.
For media inquiries, email .